最近觉得半瓶醋的16S数据分析可以继续进行深入学习了,但是又不知道怎么来学习,于量就迈向宏基因组的领域,这是一个趋势,毕竟,16S的相对含量准确度有待商榷呀。宏基因组获得的相对丰度应该是更接近真实情况,更能说明问题,当然,它的成本还是一大问题,不算建库成本的话,每个样本按测5g的数据量来计算的话,成本在几百元左右,算上建库成本,要上千了。
1.下载数据
于是,下载点数据,试试呀。下载的数据来自最近刚刚发表的一篇nature文章里meta分析的一个中国人直肠癌肠道微生物研究的课题。
#就是我前一篇博客里用到的命令
ascp -QT -l 300m -P33001 -L- -k1 -i asperaweb_id_dsa.openssh era-fasp@fasp.sra.ebi.ac.uk:vol1/fastq/ERR101/005/ERR1018205/ERR1018205_1.fastq.gz /Volumes/MacOS/BioData/metagenomics
2. 安装软件
source /Volumes/MacOS/Miniconda3/bin
#正常安装提示要把python降为2.7,所以这里新建一个环境中
conda create -n metaphian2 python=2.7
conda activate metaphian2
conda install metaphlan2
onda install graphlan
conda install export2graphlan
3.获得物种profiling表格
真的是一个命令就行,很简单的,我的命令在这:
metaphlan2.py --input_type fastq ERR1018205_1.fastq.gz > profiled_metagenome.txt
然后就得到了各个级别的物种分类:
#SampleID       Metaphlan2_Analysis
k__Bacteria     99.93552
k__Eukaryota    0.06448
k__Bacteria|p__Firmicutes       42.31649
k__Bacteria|p__Bacteroidetes    34.30539
k__Bacteria|p__Actinobacteria   19.19014
k__Bacteria|p__Proteobacteria   4.10135
k__Eukaryota|p__Ascomycota      0.06448
k__Bacteria|p__Fusobacteria     0.01318
k__Bacteria|p__Verrucomicrobia  0.00898
k__Bacteria|p__Bacteroidetes|c__Bacteroidia     34.30539
界: k__, 门: p__, 纲: c__, 目: o__, 科: f__, 属: g__, 种: s__,后面还有典型菌株吗?type__,各个级别均能加和到100%。
4.画个单样本热图
metaphlan_hclust_heatmap.py -c bbcry --top 25 --minv 0.1 -s log --in profiled_metagenome.txt --out abundance_heatmap.pdf
这就得到了前25丰度物种的热图了,当然是在种的级别画的。

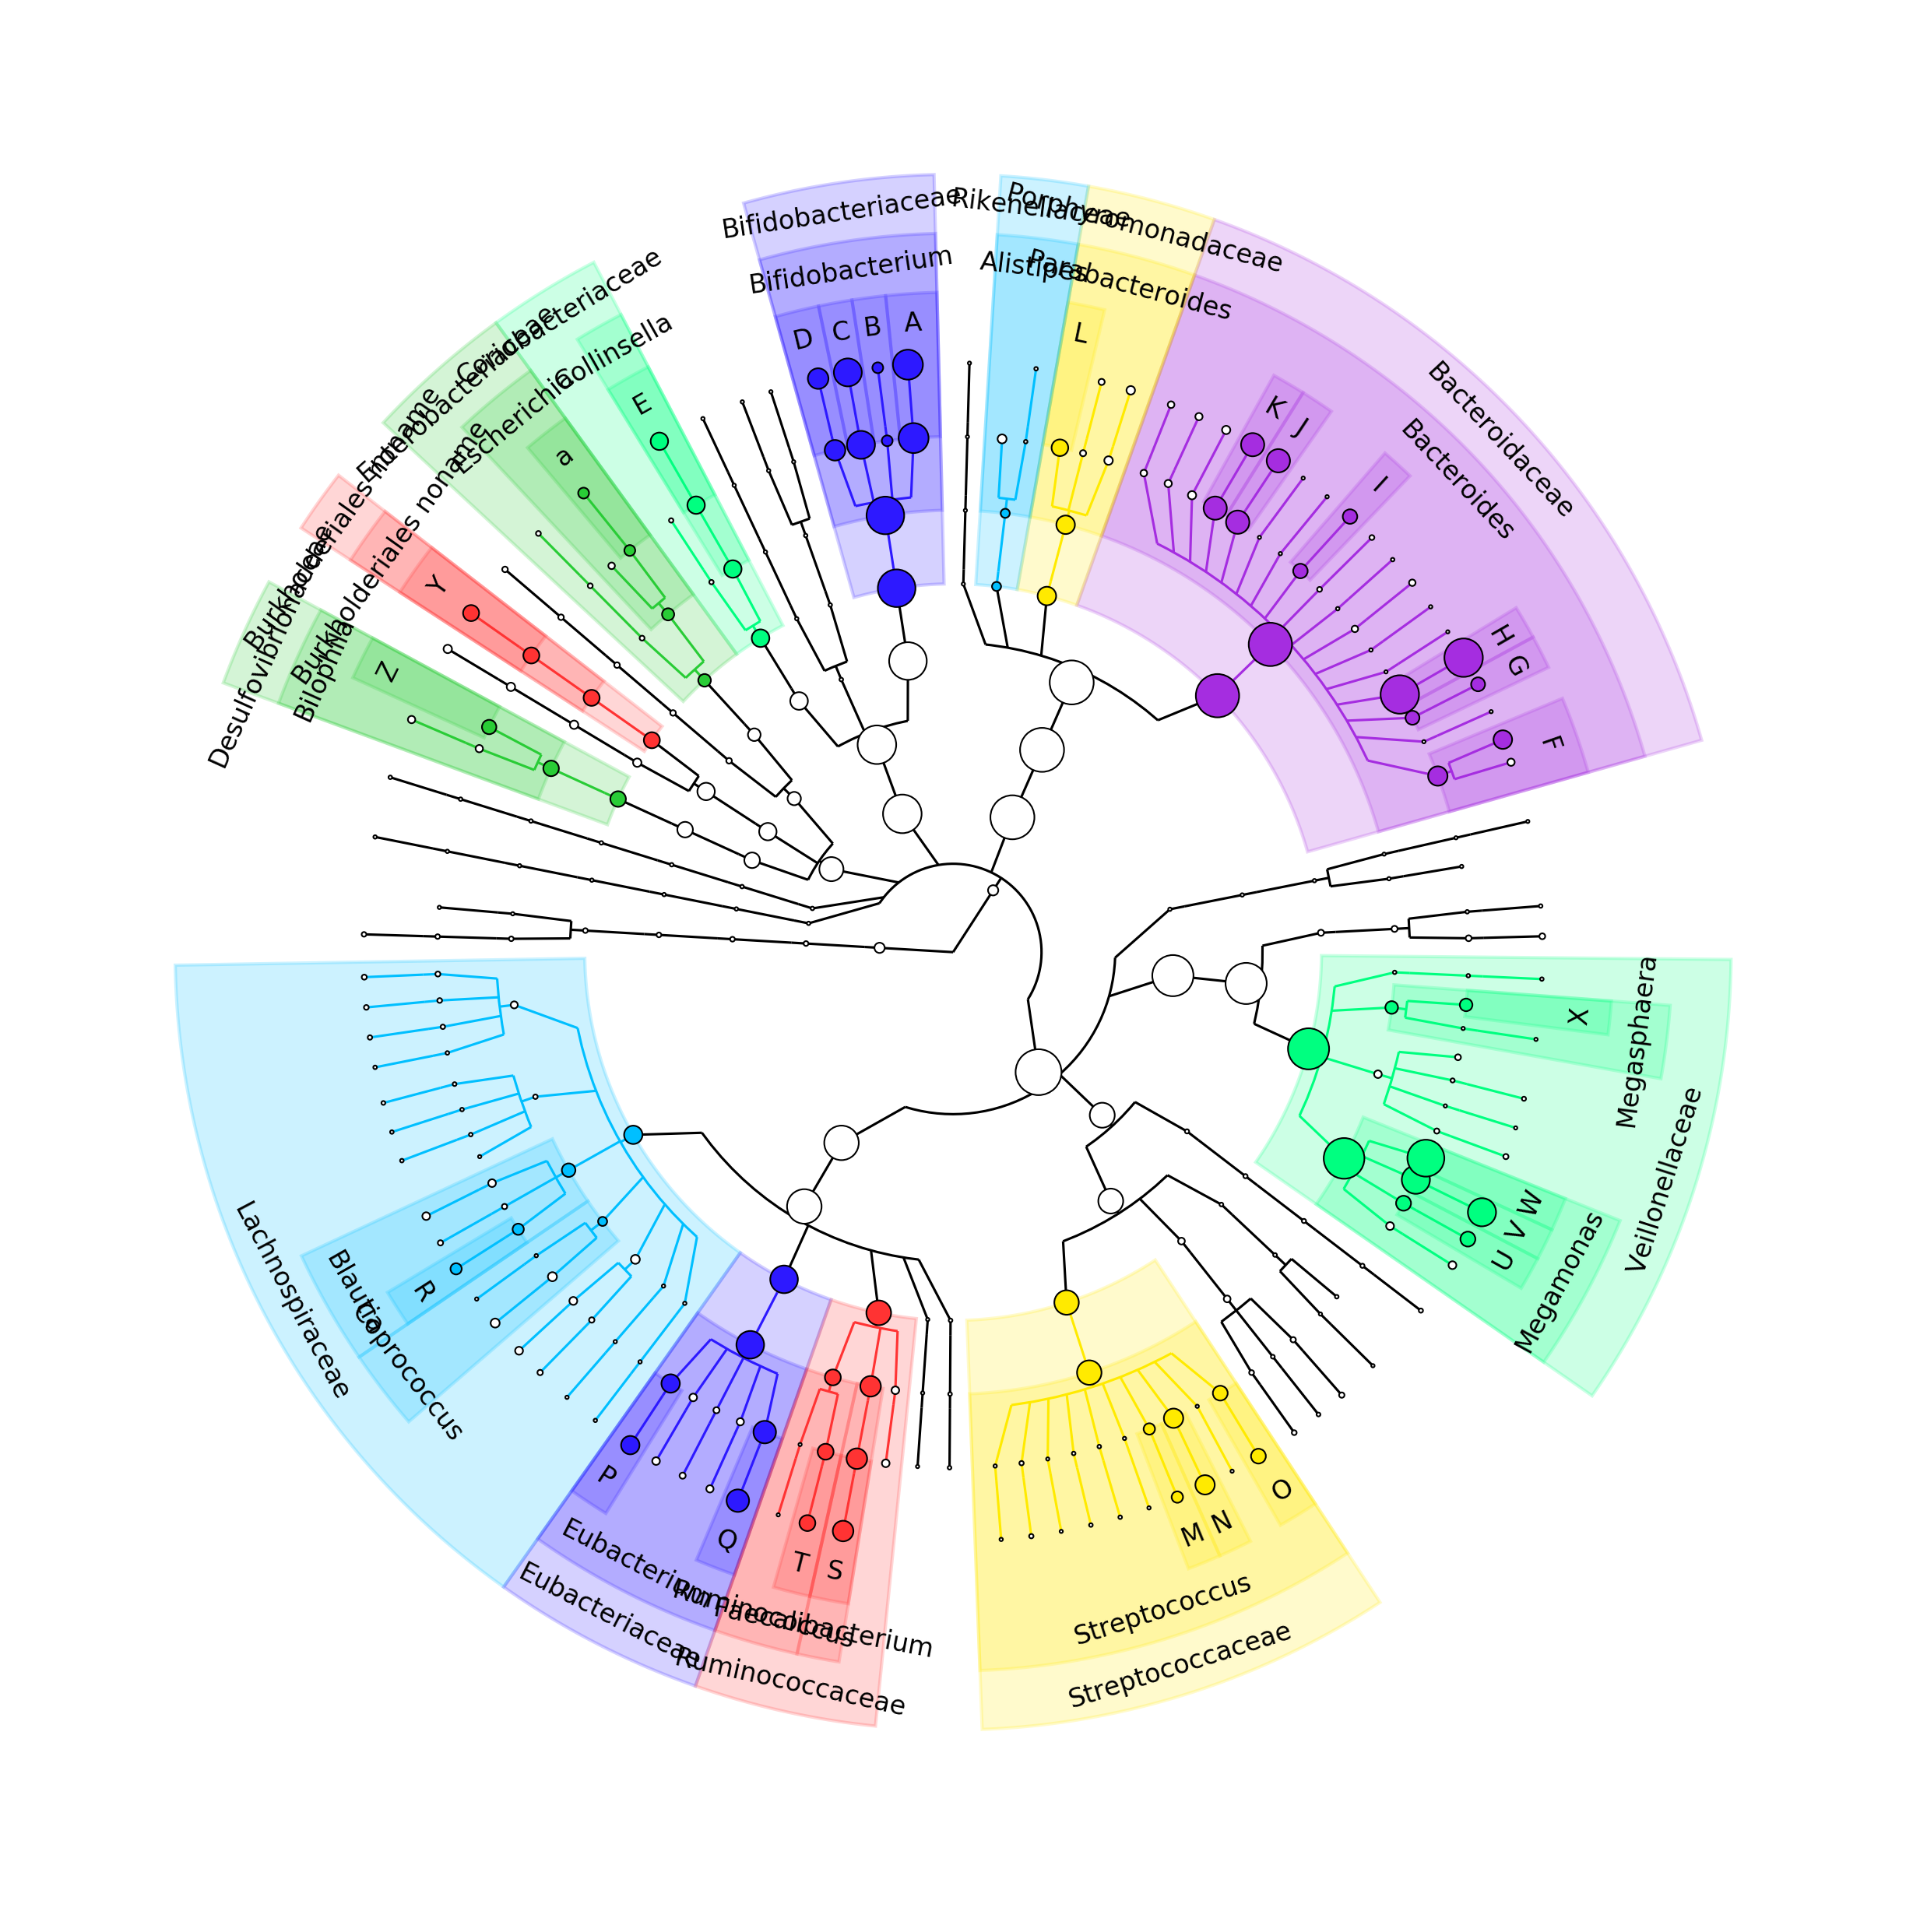
5. 画个漂亮点的树
# 基于丰度表生成graphlan文件
export2graphlan.py --skip_rows 1,2 -i profiled_metagenome.txt --tree merged_abundance.tree.txt --annotation merged_abundance.annot.txt --most_abundant 100 --abundance_threshold 1 --least_biomarkers 10 --annotations 5,6 --external_annotations 7 --min_clade_size 1
#绘图
graphlan_annotate.py --annot merged_abundance.annot.txt merged_abundance.tree.txt merged_abundance.xml
graphlan.py --dpi 300 merged_abundance.xml merged_abundance.png --external_legends

美不胜收的图就到手了,真的很傻瓜的分析,除了如果电脑性能不够给力会耗时较长,2.6G约一个小时,没有多线程加速的情况下。
Intestinibacter怎么翻?