最近开始阅读一本关于机器学习的新书,分享一些笔记给大家!
挖掘RMS Titanic数据集
六个阶段
提出问题、数据采集、数据清洗、基础数据分析、高级分析和模型评估 直接上代码呀!数据下载,需要科学地上网下载地址
# 数据下载
train.data <- read.csv("train.csv", na.strings = c("NA", ""))
# 类型转换,分类变量转因子
train.data$Survived <- factor(train.data$Survived)
train.data$Pclass <- factor(train.data$Pclass)
# 检测缺失
sum(is.na(train.data$Age) == TRUE)/length(train.data$Age)
sapply(train.data, function(df){
  sum(is.na(df)==TRUE)/length(df)
})
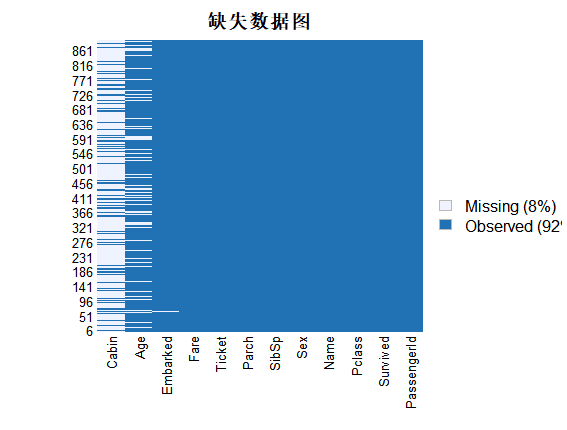
# 缺失数据可视化
# install.packages("Amelia")
require(Amelia)
missmap(train.data, main = "缺失数据图")
AmeliaView()
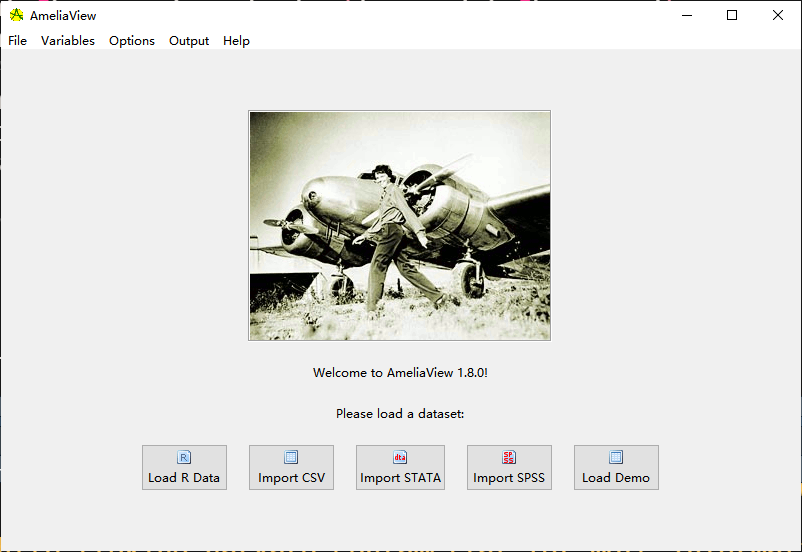 AmeliaView有交互式的GUI,赞一个!
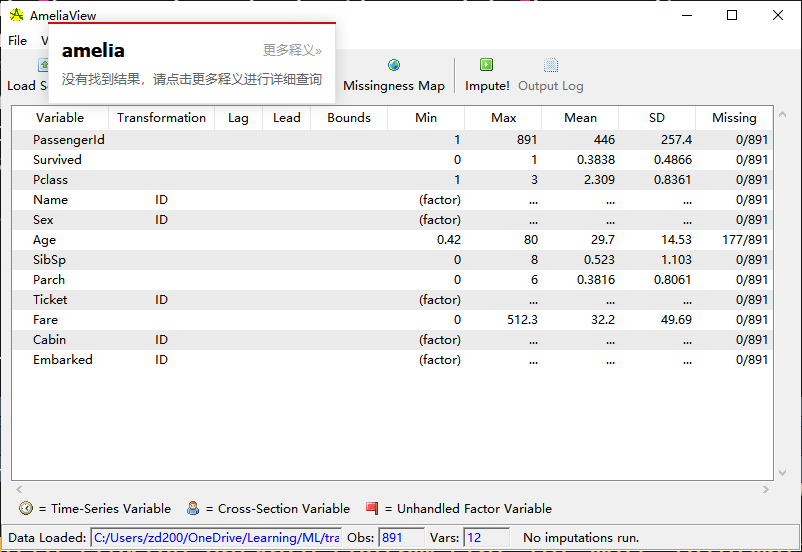
table(train.data$Embarked,useNA = "always")
# C    Q    S <NA>
 168   77  644    2
# 将缺失处理为理可能结果
train.data$Embarked[which(is.na(train.data$Embarked))] <- 'S'
table(train.data$Embarked,useNA = "always")
#  C    Q    S <NA>
 168   77  646    0
# 获得不同称呼类别
train.data$Name <- as.character(train.data$Name)
# 先用空白标记
table_words <- table(unlist(strsplit(train.data$Name, "\s+")))
str(table_words)
# 'table' int [1:1673(1d)] 1 1 1 1 1 1 1 1 1 1 ...
# - attr(*, "dimnames")=List of 1
# ..$ : chr [1:1673] ""Andy"" ""Annie" ""Annie"" ""Archie"" ...
sort(table_words [grep('\.',names(table_words))],
     decreasing = TRUE)
# Mr.     Miss.      Mrs.   Master.       Dr.      Rev.
      517       182       125        40         7         6
     Col.    Major.     Mlle.     Capt. Countess.      Don.
        2         2         2         1         1         1
Jonkheer.        L.     Lady.      Mme.       Ms.      Sir.
        1         1         1         1         1         1
识别和可视化
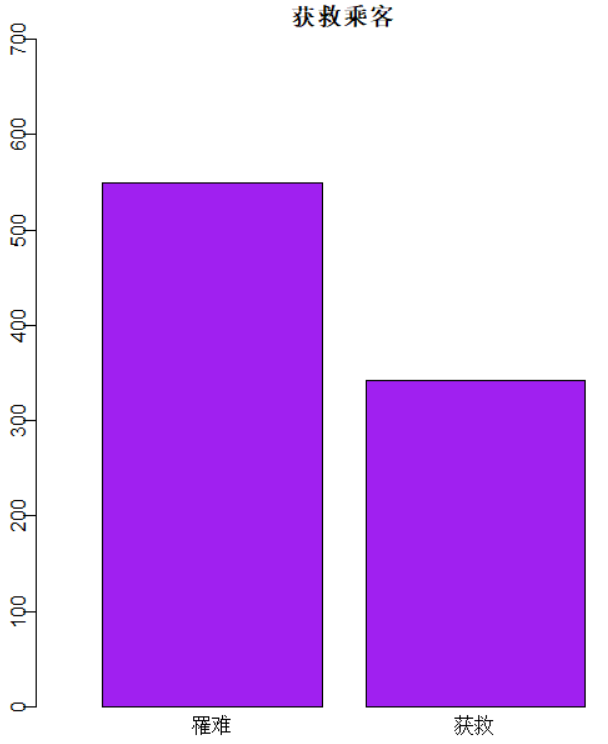

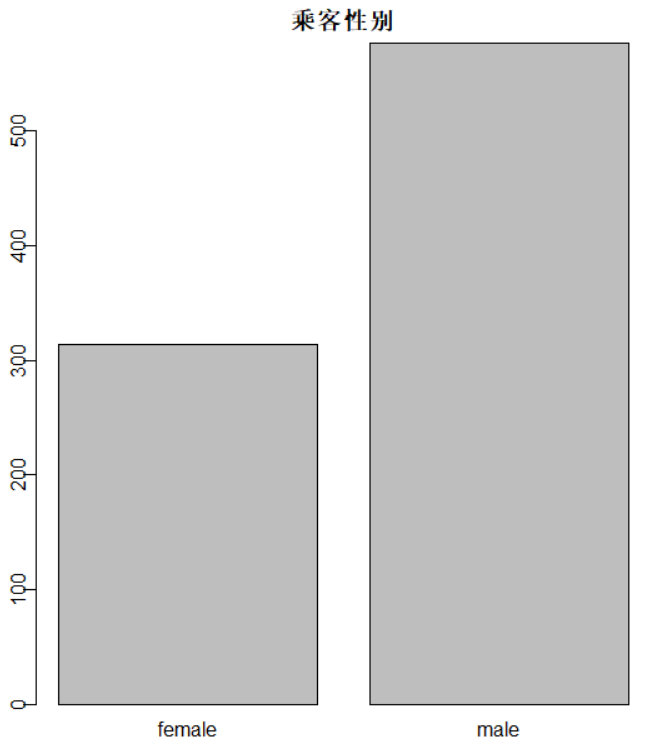


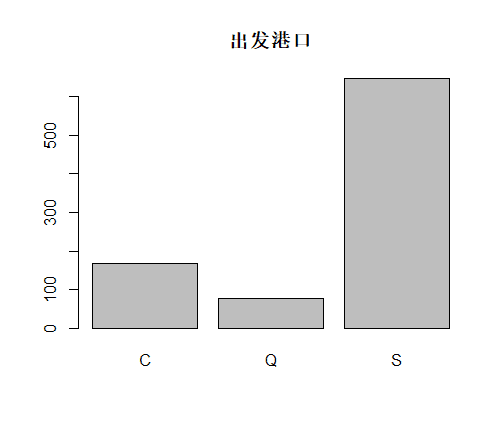
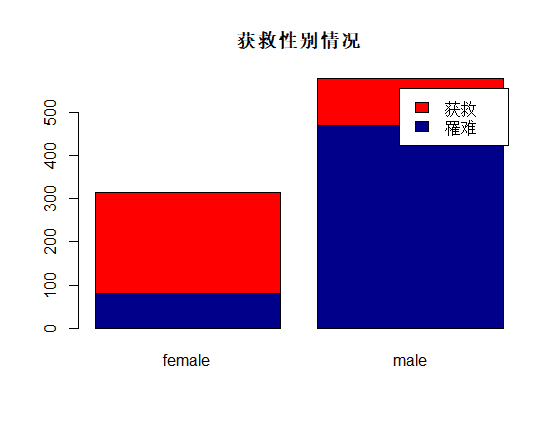
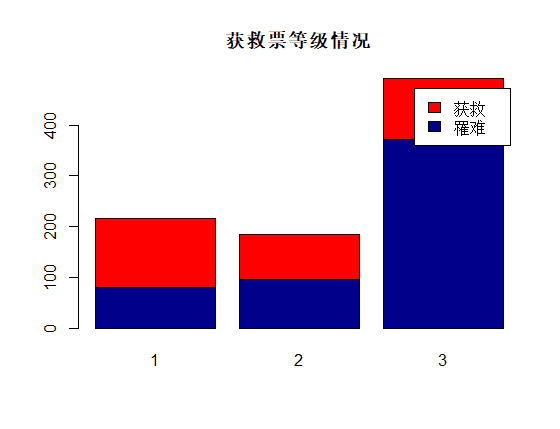
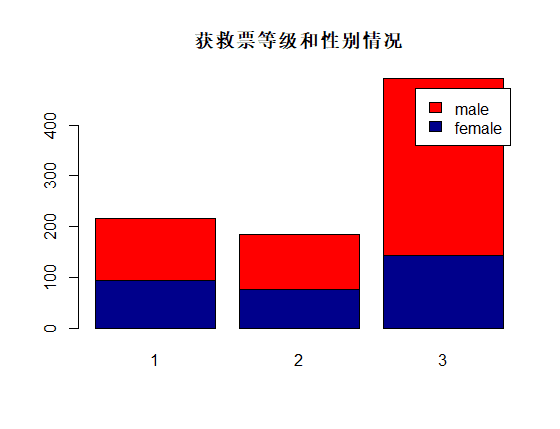
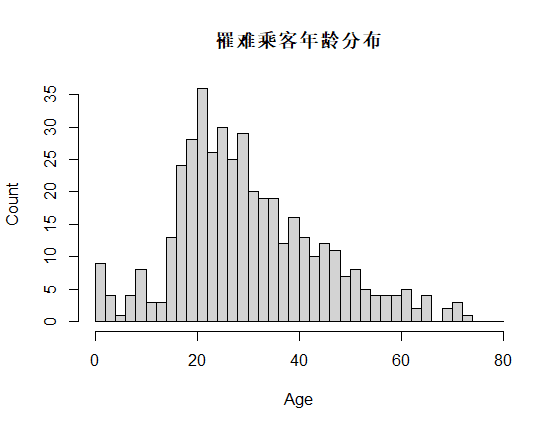
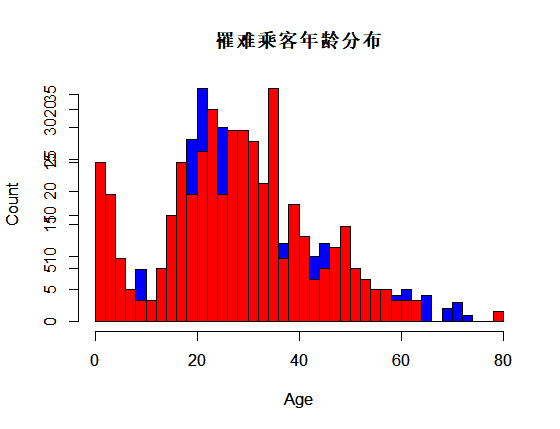
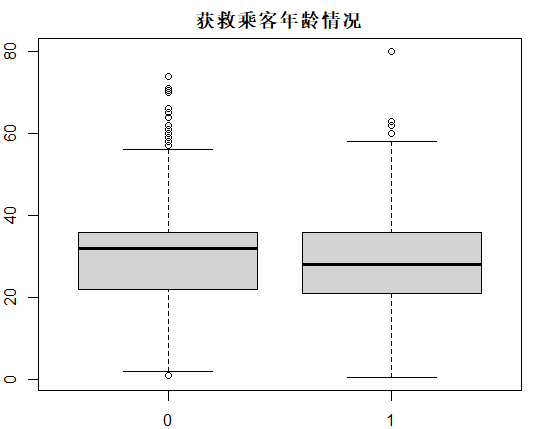
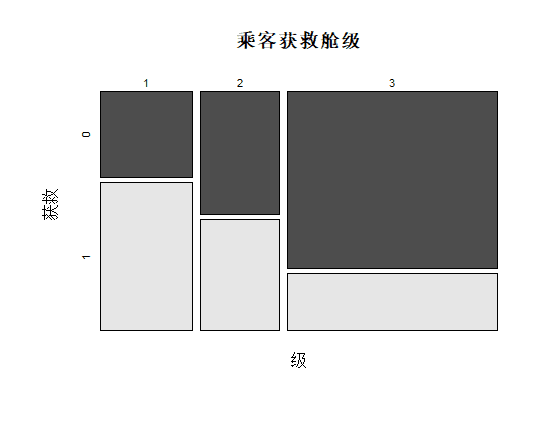
决策树构建
  Conditional inference tree with 6 terminal nodes

Response:  Survived
Inputs:  Pclass, Sex, Age, SibSp, Fare, Parch, Embarked
Number of observations:  623

1) Sex == {female}; criterion = 1, statistic = 180.207
  2) Pclass == {3}; criterion = 1, statistic = 59.081
    3)*  weights = 92
  2) Pclass == {1, 2}
    4)*  weights = 111
1) Sex == {male}
  5) Pclass == {1}; criterion = 1, statistic = 21.732
    6) Age <= 38; criterion = 0.99, statistic = 10.105
      7)*  weights = 57
    6) Age > 38
      8)*  weights = 39
  5) Pclass == {2, 3}
    9) Age <= 3; criterion = 1, statistic = 22.354
      10)*  weights = 12
    9) Age > 3
      11)*  weights = 312
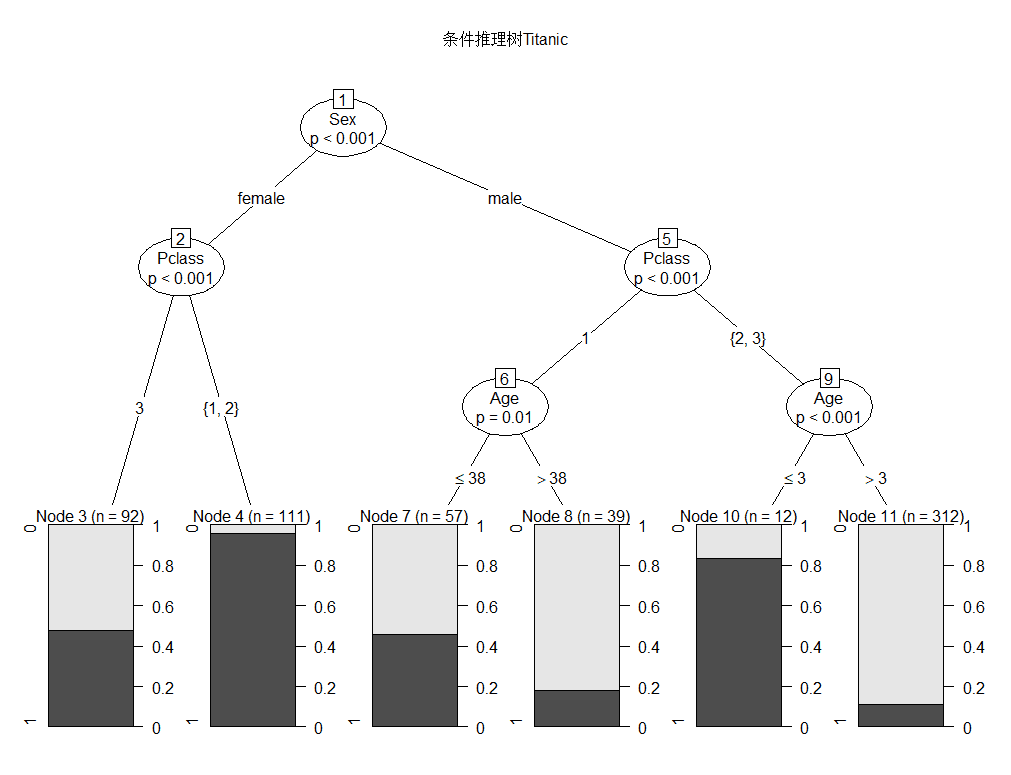
party包的决策树,与rpart包的相比,可以避免rpart包在变量选择时的倾斜,并且更倾向于选择能够产生更多分支或缺失值多的变量。
Confusion Matrix and Statistics

          Reference
Prediction   0   1
         0 146  57
         1   7  57

               Accuracy : 0.7603
                 95% CI : (0.7045, 0.8102)
    No Information Rate : 0.573
    P-Value [Acc > NIR] : 1.279e-10

                  Kappa : 0.4811

 Mcnemar's Test P-Value : 9.068e-10

            Sensitivity : 0.9542
            Specificity : 0.5000
         Pos Pred Value : 0.7192
         Neg Pred Value : 0.8906
             Prevalence : 0.5730
         Detection Rate : 0.5468
   Detection Prevalence : 0.7603
      Balanced Accuracy : 0.7271

       'Positive' Class : 0

本篇文章来源于微信公众号: 微因